Managing an industrial facility or a large-scale commercial building often feels like navigating a financial minefield, especially when the monthly utility bill arrives. You review the production output, confirm that your total operating hours remained stable, and yet the energy invoice has skyrocketed. The culprit is rarely how much total energy you consumed, but rather a hidden penalty embedded deep within commercial electricity tariffs. This penalty is tied to the brief moments when your facility draws maximum power from the grid. Understanding and controlling these instantaneous spikes is the core of modern energy cost reduction. This comprehensive guide will dissect the mechanics of peak demand management, reveal the calculation methods utilities use to penalize you, and provide actionable, non-disruptive strategies to slash your operational expenses.
WHY IS YOUR COMMERCIAL ENERGY BILL SO HIGH?
Many business owners and facility managers operate under a fundamental misconception regarding their utility expenses. They believe that reducing their electricity bill simply requires consuming less total power. While switching to efficient lighting or shutting off idle computers is admirable for general sustainability, these minor behavioral adjustments barely make a dent in a heavy commercial or industrial invoice. To understand why your energy costs remain stubbornly high despite your conservation efforts, you must examine the specific, bifurcated structure of commercial utility tariffs.
Unlike standard residential bills, which generally charge a flat rate for every unit of energy consumed throughout the month, commercial bills are split into two completely distinct categories. According to comprehensive data from the National Renewable Energy Laboratory (NREL), the demand portion can constitute anywhere from 30% to a staggering 70% of a commercial facility’s total monthly electricity bill.
Energy Charge: This component bills you for the total volume of electricity your facility used over the entire billing cycle, measured in kilowatt-hours.
Demand Charge: This component has absolutely nothing to do with your overall volume. Instead, it measures the maximum rate at which you consumed electricity at any given instantaneous moment, measured in kilowatts.
The core problem is not that your factory used a massive amount of electricity over a 30-day period. The critical issue is how fast and how intensely you demanded that electricity from the grid during your absolute busiest operational moments. That specific demand charge, triggered by equipment starting simultaneously, is the profit-draining tumor we are targeting today.
WHAT IS PEAK DEMAND MANAGEMENT? (AND KW VS. KWH EXPLAINED)
To solve the billing crisis, we must establish a clear definition. Peak demand management is not a blind, desperate attempt to turn off machines and halt production. Rather, it is a highly systematic strategy employed by enterprises to monitor, schedule, and optimize high-energy-consuming equipment, proactively reducing the maximum instantaneous power drawn from the grid while maintaining full operational output. To truly grasp this concept, decision-makers must resolve the most common confusion in the electrical sector: the fundamental difference between power and energy.
Kilowatt (kW)
Power: This represents the instantaneous rate of electricity flow. It is the immediate demand or physical “pull” your equipment places on the utility grid at a specific second in time.
Kilowatt-Hour (kWh)
Energy: This represents the total accumulation of electrical work done over a period. It is the actual physical volume of electricity consumed by your facility throughout the month.
Consider the classic water pipe and bucket analogy. Imagine you are tasked with filling a massive storage tank with water. The kilowatt-hour (kWh) is the total amount of water sitting inside the bucket at the end of the month. You pay for every drop. The kilowatt (kW), on the other hand, is the physical diameter of the water pipe required to fill it. If you open a small valve and fill the tank slowly over a 24-hour cycle, you only need a very thin pipe. However, if you demand that the exact same tank be filled in exactly five minutes, you force the utility company to build a gigantic, high-pressure industrial pipe just to handle your sudden rush of water. You are not just paying for the water; you are paying the grid a massive infrastructure fee for forcing them to build and maintain that giant pipe. Peak demand management is the engineering art of keeping your pipe size as small as possible while still getting all the water your production line needs.
DEMAND RESPONSE VS. PEAK DEMAND MANAGEMENT
Before diving into the specific engineering strategies, it is critical to establish the boundaries of our operational framework. Industry professionals frequently confuse two distinct concepts, leading to misguided expectations regarding financial returns. We must separate offensive grid-saving tactics from defensive bill-saving strategies.
Demand Response: This is an event-driven, offensive strategy. During extreme weather conditions, when the regional utility grid is on the verge of collapsing under the strain of millions of air conditioners, the utility company will declare a grid event. They will contact participating commercial facilities and ask them to voluntarily shut down heavy equipment or drop their load. If your facility complies and helps the grid survive the crisis, the utility company compensates you with an incentive payment. You are essentially acting as a firefighter for the grid.
Peak Demand Management: This is a daily, routine, defensive strategy. You execute this strategy entirely for your own internal financial benefit, without any prompting from the utility company. Your daily objective is to keep your facility’s power peaks as low and smooth as possible to minimize the punitive demand charges on your standard monthly invoice. Today, we are not discussing how to chase occasional grid incentives by shutting down your plant. We are focusing purely on smart, daily scheduling to defend your existing profit margins from utility penalties.
HOW UTILITIES CALCULATE YOUR PEAK DEMAND CHARGES
The calculation of demand charges is often treated as a complex black box by commercial consumers, leading to extreme financial vulnerability. Utilities do not sit and watch your meter every single second to catch a microscopic spike. Instead, they divide your entire billing month into specific, rigid intervals. Your smart meter continuously calculates your average power demand during these consecutive intervals.
The Universal Calculation Formula:
[Highest Peak kW Recorded in Any 15-Minute Window] × [Utility Demand Rate $/kW] = [Total Demand Charge]
15-Minute Rolling Window: This is the most common interval used by utility providers in North America and Europe. The meter averages your power draw over 15 minutes. A single one-second motor startup surge will not ruin your bill, but 15 solid minutes of high-intensity consumption will trigger the penalty.
Let us look at a realistic, disastrous financial scenario. Suppose your local utility charges a demand rate of $15 per kW. Under normal, highly optimized operating conditions, your manufacturing plant runs smoothly with a steady baseline demand of 500 kW. Your expected demand charge would be $7,500. However, early one Monday morning, a shift supervisor makes a sequencing error and starts up three heavy-duty injection molding machines, the main air compressors, and the entire facility HVAC system simultaneously. The power draw spikes to 1,500 kW and stays there for a full 15 minutes. Because of this single operational mistake, your demand charge for the month instantly skyrockets to $22,500. You just lost $15,000 of pure profit in a quarter of an hour.
Ratchet Clause: The nightmare does not end there. Many commercial utility contracts contain a ratchet clause. This aggressive billing mechanism dictates that the highest peak demand you record during a peak summer month will be locked in as your minimum billable baseline for the next 11 consecutive months. Even if your factory scales down production or shuts down for maintenance in the winter, you will still pay a penalty based on that one chaotic summer morning.
Coincident Peak: Furthermore, in certain highly regulated regional grids, you may be subjected to coincident peak pricing. Under this brutal mechanism, you are penalized not just for your own maximum usage, but for how much power you were consuming during the exact single hour of the year when the entire regional grid reached its absolute highest load. You are effectively paying a premium for contributing to the grid’s maximum stress point.
THE 3 TIERS OF PEAK DEMAND MANAGEMENT
Understanding the terrifying financial implications of the 15-minute window is only the diagnosis. The cure involves implementing robust engineering strategies for holistic peak demand & capacity management to flatten your load profile. To guide your decision-making, we have structured the solutions into a three-tier framework.
Tier 1: Operational Adjustments (Load Shifting & Shedding)
This foundational tier requires practically zero hardware investment, relying instead on rigorous production planning, behavioral changes, and modifications to your existing programmable logic controllers. However, it requires the highest level of ongoing management discipline.
Load Shifting: This involves relocating high-energy-consuming tasks from peak daytime hours to off-peak night hours. A critical industrial application of this is motor staggering. Instead of allowing your facility to boot up all conveyor belts, crushers, and heavy pumps simultaneously at the start of a shift, engineers program an interlock logic into the system. This introduces a calculated 15-minute to 30-minute delay between the activation of major motor groups.
Load Shedding: This focuses on achieving temporary peak load reduction by dropping power consumption when telemetry indicates the facility is close to breaching a new peak demand threshold. Shedding does not mean pulling the emergency stop on your main production line. You can utilize the thermal inertia of a large building to safely raise the setpoint of your facility HVAC system. However, you must absolutely never apply load shedding to core process equipment, such as process cooling pumps.
Tier 2: Automated Control via Energy Management Software (EMS)
While manual operational adjustments are a good starting point, they possess a fatal flaw: human reaction time. Relying on facility personnel to watch energy dashboards is a losing battle against utility algorithms. It is comparable to driving a vehicle by only looking in the rearview mirror.
Predictive Analytics: Advancing to the second tier requires an intelligent digital brain capable of ai-powered scheduling for peak demand management. A modern Energy Management Software ingests historical consumption data, real-time weather forecasts, and your specific production schedules to accurately predict your load profile hours in advance.
Automated Dispatch: When the software calculates a high probability that your facility will breach its predefined demand threshold, it operates on total autopilot. It sends immediate digital commands to variable frequency drives to gracefully dial back non-essential auxiliary equipment silently, driven purely by algorithms rather than human panic.
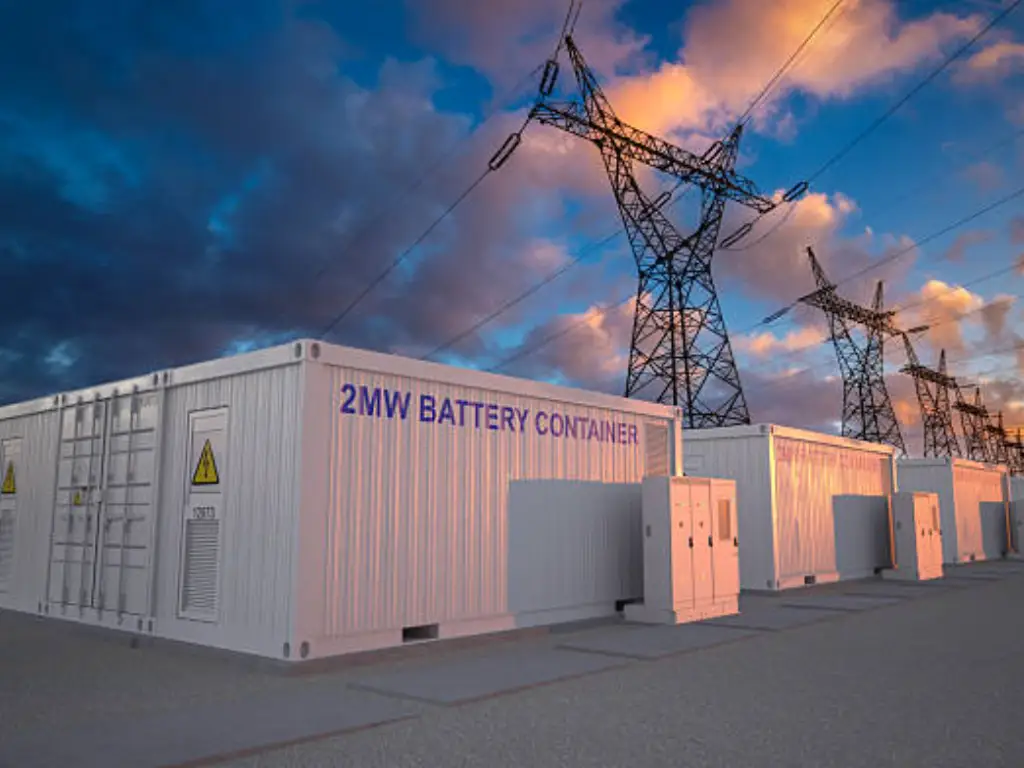
Tier 3: Behind-the-Meter Battery Storage (BESS)
For high-output manufacturing plants, massive data centers, or heavily utilized commercial spaces, Tier 1 and Tier 2 strategies eventually hit a physical wall. When your operations are running at absolute maximum capacity to meet explosive order volumes, there is simply no room to shift schedules. When human intervention and software limits are exhausted, hardware becomes the ultimate, foolproof solution.
| Intervention Strategy | Deployment Cost & Financial Model | Impact on Production Operations |
|---|---|---|
| Manual Load Shedding | Low. Requires PLC logic updates and staff training. | High risk of human error. Limits capacity during peak seasons. |
| Automated EMS Control | Medium. Requires software licensing and sensor integration. | Low risk. Manages auxiliary systems but still requires operational compromises. |
| Behind-the-Meter BESS | Capital intensive. Can be offset via EaaS or ITC subsidies. | Absolute zero disruption. Completely invisible to internal operations. |
Partnering for Success: How Beny Helps You Manage Peak Demand
This stark reality is why forward-thinking, energy-intensive enterprises choose to deploy advanced hardware like the BENY Commercial and Industrial Battery Energy Storage System. When a facility integrates a premium BESS, the physics of power management fundamentally shift from painful compromises to seamless defense.
Dynamic Feed-forward Control
The true power of the BENY hardware lies in its integration with predictive software. We do not rely on outdated, reactive models. When a fleet of heavy compressors starts up, the system utilizes predictive offset. Before the 15-minute window can even register a dangerous surge, the BENY energy storage cabinets automatically dispatch their stored energy behind the meter. They seamlessly provide the exact amount of power needed to offset the excess grid draw.
Industrial-Grade Safety
The BENY BESS architecture is engineered with highly stable cell chemistries and rigorous thermal management systems that strictly comply with UL 9540A thermal runaway propagation testing standards and the comprehensive NFPA 855 installation codes. It acts as an invisible, highly secure, and compliant shield protecting your facility.
Strategic ROI and Financing
Facilities can often deploy these systems utilizing an Energy-as-a-Service model, requiring zero upfront capital, or leverage government incentives like the Investment Tax Credit (ITC) to dramatically accelerate the return on investment and bypass initial barriers.

HOW TO AUDIT YOUR FACILITY AND BUILD A BUSINESS CASE
Understanding the engineering theory is excellent, but transforming this knowledge into corporate savings requires decisive action. Transitioning from recognizing a financial bleed to securing board approval for a comprehensive energy upgrade requires a foolproof business case based purely on your facility’s unique data. Follow this precise, low-friction audit checklist to reclaim your budget:
Step 1: Execute a Self-Assessment
Before pulling complex data, establish a baseline of your potential losses. Utilize online peak penalty estimators. By simply inputting your operating state, average peak kilowatts, and current utility rate, you can immediately reveal the rough, often shocking, dollar amount your facility is wasting on unmanaged demand spikes every year.
Step 2: Establish a Secure Data Perimeter
We understand that industrial load profiles contain highly sensitive operational secrets. Before any deep analysis occurs, we commit to executing a comprehensive mutual non-disclosure agreement. Your production schedules and energy signatures remain strictly confidential and protected under binding legal frameworks.
Step 3: Secure a Professional ROI Analysis
Do not approach your executive board with vague concepts and assumed hardware costs. Under the protection of the NDA, submit your raw 15-minute interval data to the BENY engineering team. We will perform a rigorous, 8760-hour customized audit. You will receive a data-driven report specifying the exact BESS capacity required and a definitive financial model proving exactly how many months it will take for the system to pay for itself.
CONCLUSION
Commercial energy bills are no longer fixed overhead costs that must be passively accepted as the price of doing business. The structure of utility demand charges aggressively penalizes enterprises for brief moments of intense power usage, often locking them into punishing financial tiers for an entire year due to strict ratchet clauses. By understanding the critical engineering distinction between energy consumption and power demand, you unlock the ability to regain control over your operational expenses.
Whether you begin with rigorous load shifting protocols, integrate intelligent software for automated predictive dispatch, or deploy a robust, safety-certified commercial battery energy storage system to provide an impenetrable shield against grid penalties, the path forward is definitive. Stop allowing utility algorithms and 15-minute rolling windows to dictate your profit margins. Audit your historical load profile, embrace intelligent peak demand management, and transform your facility’s energy strategy from a financial liability into a formidable competitive advantage.