Based on Lazard’s latest Levelized Cost of Storage (LCOS) report and BloombergNEF cell pricing trends, this guide cuts through the sales jargon to deliver the hard numbers behind actual commercial battery storage cost structures. We break down the true CapEx, the hidden OpEx, and the realistic math required to build a bulletproof business case.
How Much Does a Commercial Battery System Actually Cost?
Let’s establish the baseline. Turnkey system costs vary radically based on the physical footprint of your facility and the economies of scale.
Ballpark Figures for Small to Mid-Sized Facilities (100kW – 500kW)
For mid-sized commercial buildings, supermarkets, offices, or light manufacturing floors with heavy HVAC loads, the per-kWh cost is typically higher. This is due to the “base pricing” of grid interconnection permitting and Energy Management System (EMS) controllers, which cannot be easily amortized over a smaller battery bank.
| System Size (Power/Capacity) | Ideal Application | Estimated Turnkey Cost | Average $/kWh |
|---|---|---|---|
| 100kW / 200kWh | Supermarkets, Offices, Heavy HVAC | $110,000 – $150,000 | $550 – $750 |
| 250kW / 500kWh | Mid-sized Manufacturing, Cold Storage | $250,000 – $350,000 | $500 – $700 |
Pricing for Megawatt-Scale Industrial Sites (1MW+)
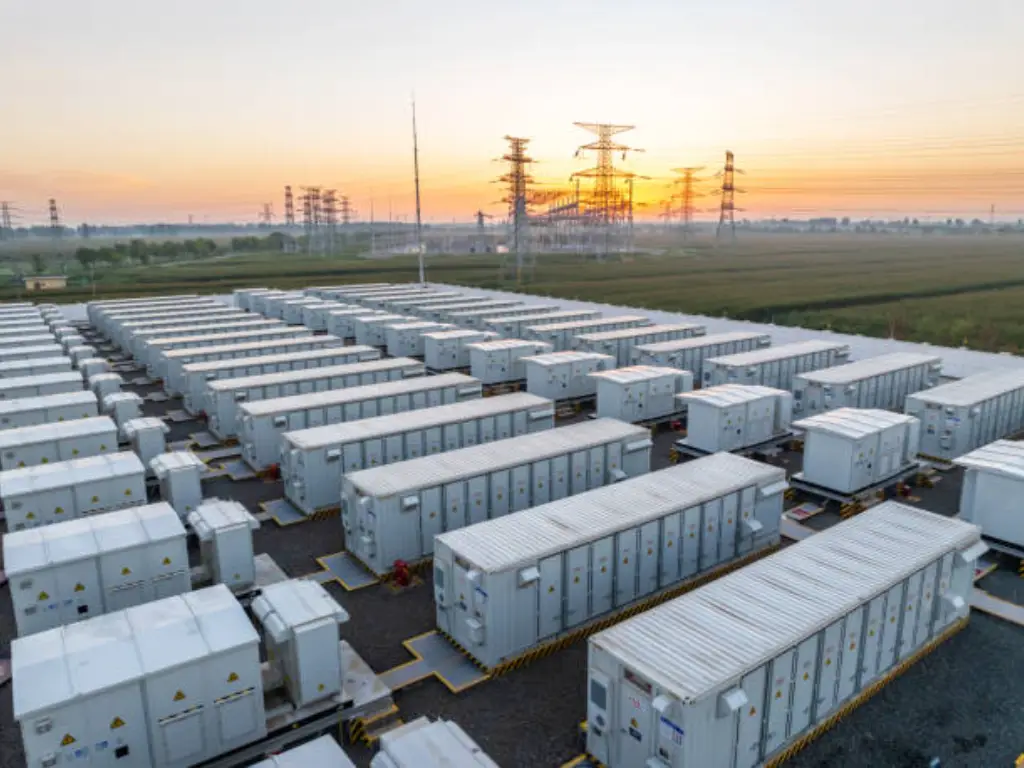
Once you scale up to heavy industrial plants or data centers, the industry standard shifts to standard 20-foot containerized energy storage solutions. Because you are essentially buying battery cells at wholesale volume, the marginal hardware cost plummets, driving the turnkey industrial battery storage cost down to an average of $350 – $500/kWh.
Where Does the Money Go? (The True CapEx Breakdown)
When reviewing a seven-figure invoice, CFOs need to know exactly what they are financing. Look at “The Cost Iceberg” below: the hardware is visible above the surface, but the soft costs hidden below are what usually sink a project’s budget.
- Battery Cells (30-40%)
- PCS & EMS (20-25%)
- HVAC & Fire (10%)
- Soft Costs: Engineering, Permitting & Labor (20-30%)
The Core Hardware: Cells, Inverters, and EMS
Contrary to popular belief, the actual LFP Battery Cells make up only 30% to 40% of the cost. You must also budget for:
- PCS / Inverters (15-20%): The heavy-duty bidirectional power conversion systems.
- EMS – Energy Management System (5-8%): Often overlooked, the EMS hardware and local integration cost are vital for system intelligence and grid communication.
- HVAC & Fire Suppression (10%): Critical safety mechanisms required to meet local fire codes.
The Soft Cost Trap: Engineering, Permitting, and Labor
Soft costs easily account for 20-30% of your total CapEx. Sourcing battery racks, inverters, and fire suppression systems separately means paying premium local electricians to assemble them on-site for weeks.
INDUSTRY CASE: How BENY Pre-engineered Systems Cut Soft Costs by 30%
To combat out-of-control labor rates, pragmatic CFOs are now exclusively approving “All-in-One” pre-engineered systems.
Utilizing the BENY C&I Energy Storage System, all components including Tier-1 LFP packs, BMS, PCS, and fire suppression are fully integrated into a single IP55 cabinet at the factory.
The Outcome: This “plug-and-play” architecture transforms weeks of engineering into a simple “forklift and wire” task, slashing electrician hours and fast-tracking permitting.
The Hidden OpEx: What It Costs to “Run” a Battery
Sales proposals often ignore the cost of ownership. For a standard C&I project, expect annual OpEx to range from 1.5% to 3% of your total CapEx.
Parasitic Loads and Maintenance (Estimated: $3,000 – $8,000 / Year per MWh)
Your HVAC system draws “parasitic” power from your facility 24/7 to maintain cell health. Combined with EMS SaaS subscriptions and biannual filter/coolant checks, this represents a significant ongoing draw on your realized savings.
Property Insurance Premiums (Estimated: 0.5% – 1% Increase)
Installing a lithium battery alters your facility’s Fire Risk Rating. Expect your property insurance premiums to rise by roughly 0.5% to 1% of the system’s value annually. Consult your broker early to avoid a surprise in your year-two budget.
Capacity Degradation Fund (Annual Reserve: 2% of Battery Cost)
LFP cells degrade. By year 7, capacity typically drops below 80%. CFOs should reserve roughly 2% of the initial battery hardware cost annually to fund “Augmentation”—adding new battery clusters later to maintain original ROI performance.
The Core Variables That Radically Change Your Final Price
Why does your custom quote look so different? Here is how these variables impact your bill and how you should respond.
- kW vs. kWh (Duration)
Impact: A 4-hour system has a lower $/kWh but a much higher Total CapEx.
Strategy: Perform a “Peak Duration Analysis.” If your peaks only last 45 minutes, buying a 4-hour system is a waste of capital. Match duration to your specific load profile spikes.
- Battery Chemistry (LFP vs. NMC)
Impact: NMC requires blast walls and advanced fire suppression that can add 15% to your site prep cost.
Strategy: Standardize on LFP (Lithium Iron Phosphate). It is the C&I standard for a reason: it balances safety and cost without requiring extreme fire mitigation infrastructure.
- Site Complexity and Interconnection
Impact: Distance from the main panel and transformer capacity can add $20k – $50k in trenching and electrical upgrades.
Strategy: Choose an installation site as close to the main switchgear as possible. Conduct a “Feasibility Study” before purchasing hardware to identify necessary transformer upgrades.
How Commercial Batteries Actually Pay for Themselves
According to Lazard’s Levelized Cost of Storage (LCOS) report, the Internal Rate of Return (IRR) for commercial storage in high-tariff regions (like California, New York, or Germany) has reached a tipping point. Profitability isn’t just about saving; it’s about Value Stacking—layering multiple revenue streams on a single asset.
Erasing Peak Demand Charges (The “Defensive” Play)
Most industrial bills split costs into Energy Charges ($/kWh) and Demand Charges ($/kW). Demand charges are based on your highest 15-minute spike. A single power-heavy startup can trigger a penalty that lasts the entire month.
Hard Math: The 250kW Peak Shaving Sandbox
Assume your factory faces a $25/kW Demand Rate. You deploy a 250kW/500kWh system.
To maintain a safety buffer and prolong battery life, your EMS is programmed to shave a steady 200kW off your peak grid draw during high-production windows.
- Monthly Savings: 200kW (shaved) × $25 = $5,000 Saved
- Annual Gross Savings: $5,000 × 12 = $60,000
- Net ROI Impact: After subtracting ~2.5% OpEx, this provides a 4.5 to 6-year payback.
CFO Insight: This “Flatlining” effect turns an unpredictable penalty into a fixed operational gain.
Load Shifting & TOU Arbitrage (Buying Low, Using High)
If you operate in a region with Time-of-Use (TOU) rates, electricity at 2:00 PM can cost 3x more than at 2:00 AM.
- Off-Peak (Night)
Battery charges using cheap grid power or excess solar. - On-Peak (Afternoon)
Facility runs on battery power, avoiding expensive grid prices.
Making Money Back Through Grid Services (The “Offensive” Play)
Your battery is no longer just a “storage tank”; it’s a Virtual Power Plant (VPP) node. In markets like ERCOT (Texas) or National Grid (UK), you can get paid to help the grid.
- Demand Response (DR): Utilities pay you a premium to discharge your battery during a “Grid Stress Event.”
- Frequency Regulation: Short-burst discharging to stabilize grid frequency. This is often the highest-margin revenue stream in the energy sector.
By stacking these services, industrial users often see their LCOS (Levelized Cost of Storage) drop by an additional 15-20%.
Tax Credits & Incentives That Slash Your Upfront Costs
Government levers can drastically reduce your net cost, effectively paying for your down payment.
- The 30%+ Federal ITC: Standalone energy storage now legally qualifies for a baseline 30% Investment Tax Credit, meaning your overall commercial solar battery cost is heavily subsidized.
- The IRA Transferability Rule: You can now sell your ITC for cash (90-95 cents on the dollar) if you lack the tax liability to use it yourself.
- MACRS Depreciation: Accelerated depreciation allows your CFO to write off a massive portion of the asset’s value in year one.
Cash vs. PPA: Which Financing Route Makes Sense?
Direct Purchase (CAPEX) for Maximum Long-Term ROI
You fund the system outright. You absorb the CapEx and assume the long-term OpEx liabilities, but you capture 100% of the tax incentives and 100% of the operational savings. Best for capital-rich firms aiming for the highest internal rate of return (IRR).
Power Purchase Agreements (PPA) and EaaS Models
Energy-as-a-Service (EaaS). A third party owns, installs, and maintains the battery at zero upfront cost to you. You simply share a percentage of the utility savings. Ideal for strictly financially-driven, conservative organizations looking to avoid technical risk and preserve cash flow.
Should You Actually Buy One?
The 3-Minute CFO Self-Assessment
- Monthly power bill exceeds $10,000.
- Demand charges are >30% of total bill.
- Operate in a state with high TOU rates.
If you meet two or more criteria, your facility is leaking capital that a battery system could reclaim.